Real-time Security Monitoring with Fail2Ban, Filebeat, Elasticsearch, and Kibana
Learn how to set up a real-time security monitoring dashboard using Fail2Ban, Filebeat, Elasticsearch, and Kibana with guidance from Emil COZMA.
In today’s cybersecurity landscape, monitoring your infrastructure in real-time is crucial. Fail2Ban is a powerful tool for preventing brute-force attacks by analyzing log files and banning suspicious IPs. However, monitoring these bans and gaining insights from them requires an intuitive dashboard.
In this post, I will guide you through creating a real-time security monitoring dashboard using Fail2Ban Filebeat, Elasticsearch and Kibana, running in a Docker Compose environment. This setup will allow you to visualize and analyze intrusion attempts effectively.
Prerequisites
Before we dive into the implementation, ensure you have the following:
- Docker and Docker Compose installed
- A Linux server with Fail2Ban installed and configured
Step 1: Configuring Fail2Ban to Log Events
Fail2Ban logs events in /var/log/fail2ban.log by default. Ensure that your fail2ban.conf has the correct logging settings:
1
2
3
[Definition]
logtarget = /var/log/fail2ban.log
loglevel = INFO
Restart Fail2Ban to apply changes:
1
sudo systemctl restart fail2ban
Step 2: Setting Up Docker Compose for Elasticsearch, Kibana, and Filebeat
Create a docker-compose.yml file:
1
2
3
4
5
6
7
8
9
10
11
12
13
14
15
16
17
18
19
20
21
22
23
24
25
26
27
28
29
30
31
32
33
34
35
36
37
38
39
40
41
42
version: '3.7'

services:
  elasticsearch:
    image: docker.elastic.co/elasticsearch/elasticsearch:8.5.0
    container_name: elasticsearch
    environment:
      - discovery.type=single-node
      - bootstrap.memory_lock=true
      - "ES_JAVA_OPTS=-Xms512m -Xmx512m"
    ports:
      - "9200:9200"
    volumes:
      - ./data/elasticsearch:/usr/share/elasticsearch/data
    networks:
      - elk

  kibana:
    image: docker.elastic.co/kibana/kibana:8.5.0
    container_name: kibana
    depends_on:
      - elasticsearch
    ports:
      - "5601:5601"
    networks:
      - elk

  filebeat:
    image: docker.elastic.co/beats/filebeat:8.5.0
    container_name: filebeat
    user: root
    volumes:
      - /var/log/fail2ban.log:/var/log/fail2ban.log:ro
      - ./data/filebeat/filebeat.yml:/usr/share/filebeat/filebeat.yml
    networks:
      - elk
    depends_on:
      - elasticsearch

networks:
  elk:
    driver: bridge
Step 3: Configuring Filebeat to Parse Fail2Ban Logs And Send Data to ElasticSearch
Create a filebeat.yml file in the ./data/filebeat directory:
1
2
3
4
5
6
7
8
9
10
11
12
13
14
15
16
filebeat.inputs:
- type: log
  enabled: true
  paths:
    - /var/log/fail2ban.log

output.elasticsearch:
  hosts: ["http://elasticsearch:9200"]
  index: "fail2ban-filebeat"
  pipeline: "fail2ban-filebeat"

setup.template.name: "fail2ban-filebeat"
setup.template.pattern: "fail2ban-*"

setup.kibana:
  host: "http://kibana:5601"
Step 4: Validate Configuration
1
docker compose run --rm filebeat ./filebeat test config -c filebeat.yml --strict.perms=false
Step 5: Running the Services
Start the containers using Docker Compose:
1
docker-compose up -d
Verify that the services are running:
1
docker ps
Step 6: Creating an Index Template
- Open Kibana in your browser (
http://localhost:5601). - Navigate to Management > Dev Tools.
- Paste the following request code to console:
1 2 3 4 5 6 7 8 9 10 11 12 13 14 15 16 17 18 19 20 21 22 23 24 25 26 27 28 29 30 31 32 33 34 35 36 37 38 39 40 41 42 43 44
PUT _template/fail2ban-filebeat { "index_patterns": ["fail2ban-*"], "settings": { "number_of_shards": 1 }, "mappings": { "properties": { "client": { "properties": { "address": { "type": "keyword" }, "ip": { "type": "ip" }, "geo.location": { "type": "geo_point" } } }, "log": { "properties": { "level": { "type": "keyword" } } }, "protocol": { "type": "keyword" }, "process": { "properties": { "pid": { "type": "long" }, "action": { "type": "keyword" } } } } } } - Click the play button to send the request
- The response must be:
1
2
3
{
   "acknowledged": true
}
Step 7: Creating an Index
- Paste the following request code to console:
1 2 3 4 5 6 7 8 9 10 11 12 13 14 15 16 17 18 19 20 21 22 23 24 25 26 27 28 29 30 31 32 33 34 35 36 37 38 39 40
PUT /fail2ban-filebeat { "mappings": { "properties": { "client": { "properties": { "address": { "type": "keyword" }, "ip": { "type": "ip" }, "geo.location": { "type": "geo_point" } } }, "log": { "properties": { "level": { "type": "keyword" } } }, "protocol": { "type": "keyword" }, "process": { "properties": { "pid": { "type": "long" }, "action": { "type": "keyword" } } } } } } - Click the play button to send the request
- The response must be:
1
2
3
4
5
 {
   "acknowledged": true,
   "shards_acknowledged": true,
   "index": "fail2ban-filebeat"
 }
Step 8: Creating an Ingest Pipeline in Kibana to parse Fail2Ban Log and transform IP Address to GeoIP Location
Once Filebeat starts shipping logs, create an ingest pipeline in Kibana:
- Navigate to Management > Stack Management > Ingest > Ingest Pipelines.
- Click Create Pipeline > New Pipeline and enter
fail2ban-filebeatname. - Click Add a processor and choose
Grokprocessor. - Type
messagein the field form input and.*fail2ban.filter\s*\[\d*\]:\s*%{LOGLEVEL:log.level}\s*\[%{DATA:protocol}\]\s*%{DATA:process.action}\s*%{IP:client.ip}\s*-\s*%{TIMESTAMP_ISO8601:timestamp}in the patterns form input. - Add another processor for geolocation selecting
GeoIPprocessor and type inclient.ipin the field input andclient.geoin the target field input. - Click Create Pipeline.
The processors must be similar to:
1
2
3
4
5
6
7
8
9
10
11
12
13
14
15
16
[
  {
    "grok": {
      "field": "message",
      "patterns": [
        ".*fail2ban.filter\\s*\\[\\d*\\]:\\s*%{LOGLEVEL:log.level}\\s*\\[%{DATA:protocol}\\]\\s*%{DATA:process.action}\\s*%{IP:client.ip}\\s*-\\s*%{TIMESTAMP_ISO8601:timestamp}"
      ]
    }
  },
  {
    "geoip": {
      "field": "client.ip",
      "target_field": "client.geo"
    }
  }
]
Step 9: Creating a Data View
- Navigate to Analytics > Discover.
- Click Create a data view and enter
fail2ban-*name. - Type
fail2ban-*in the Index pattern field. - Click Save data view to Kibana.
You can refer to the official Kibana documentation on how to create a data view for more information.
Step 10: Building the Security Monitoring Dashboard
With the data indexed, create visualizations in Kibana:
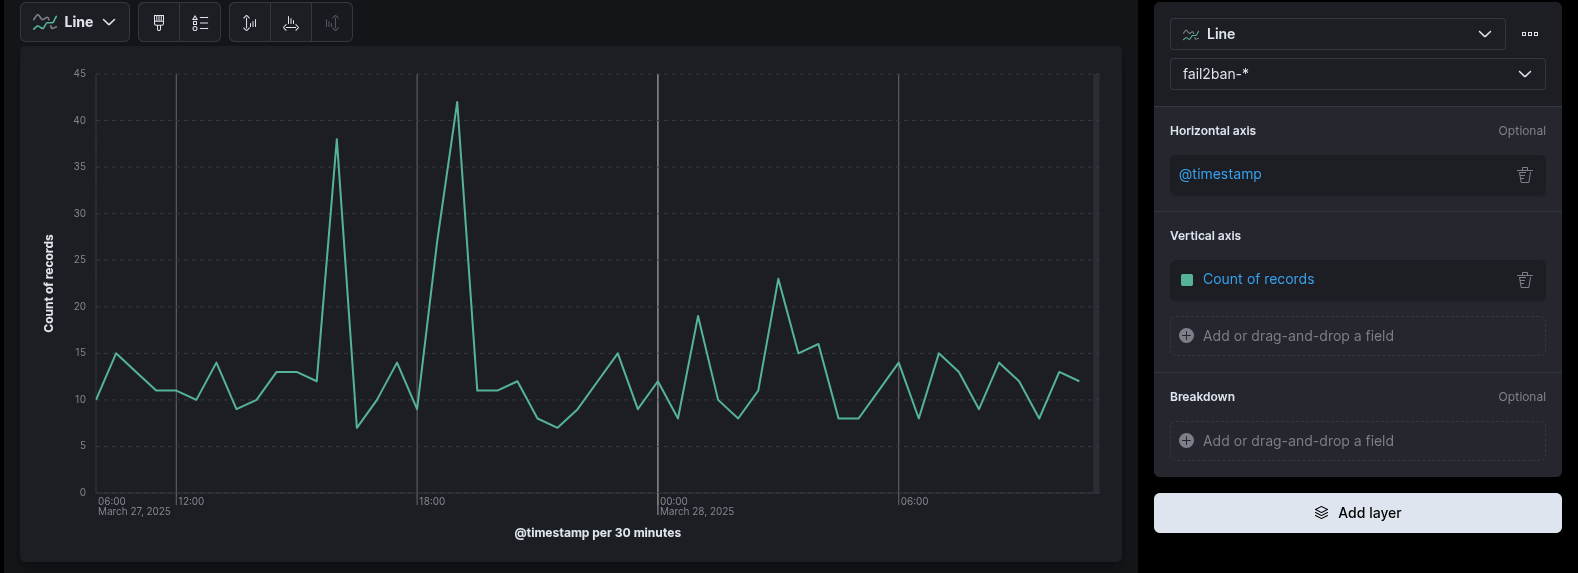
1. Create a Failed Login Attempts by time Visualization
- Go to Visualizations.
- Select a Line.
- Select Lens and choose
fail2ban-*as the index. - Drag
@timestampinto the horizontal axis. - Drag
#Recordsinto the vertical axis.
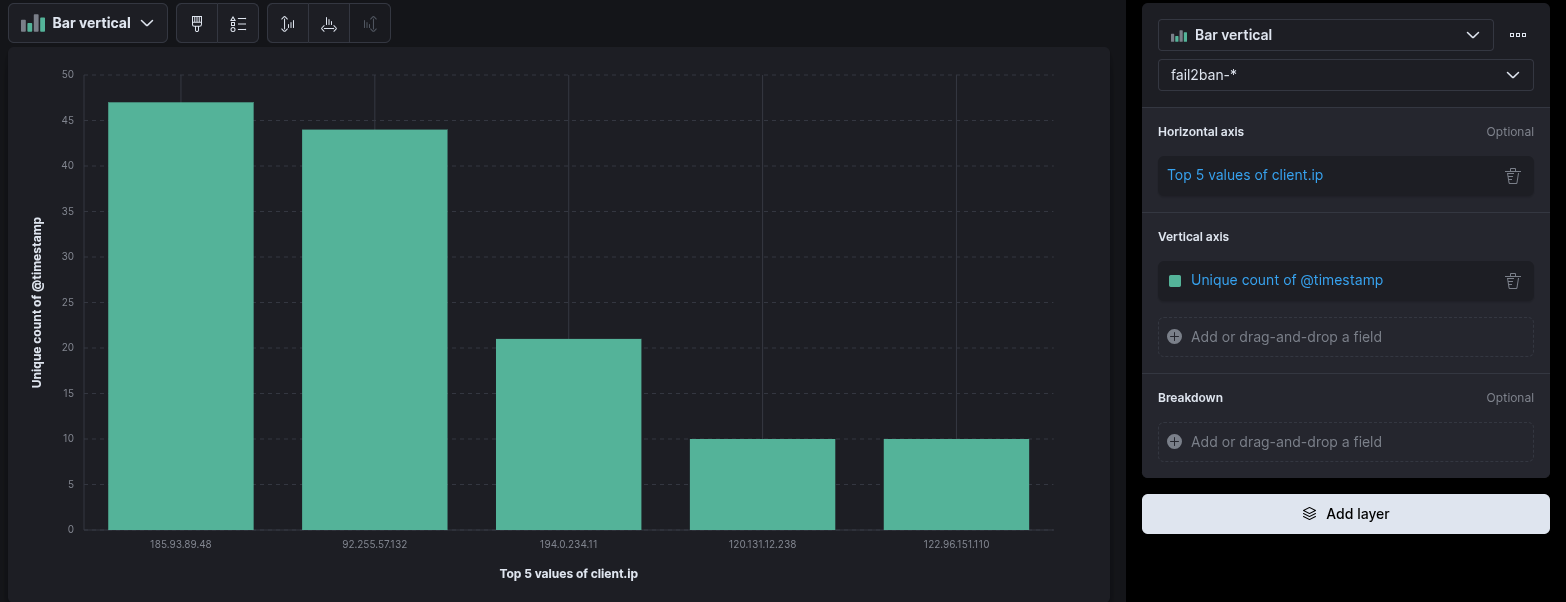
2. Top Attacking IPs
- Create a new Lens visualization.
- Select a Bar Chart.
- Drag
client.ipinto the horizontal axis. - Drag
@timestampinto the vertical axis.
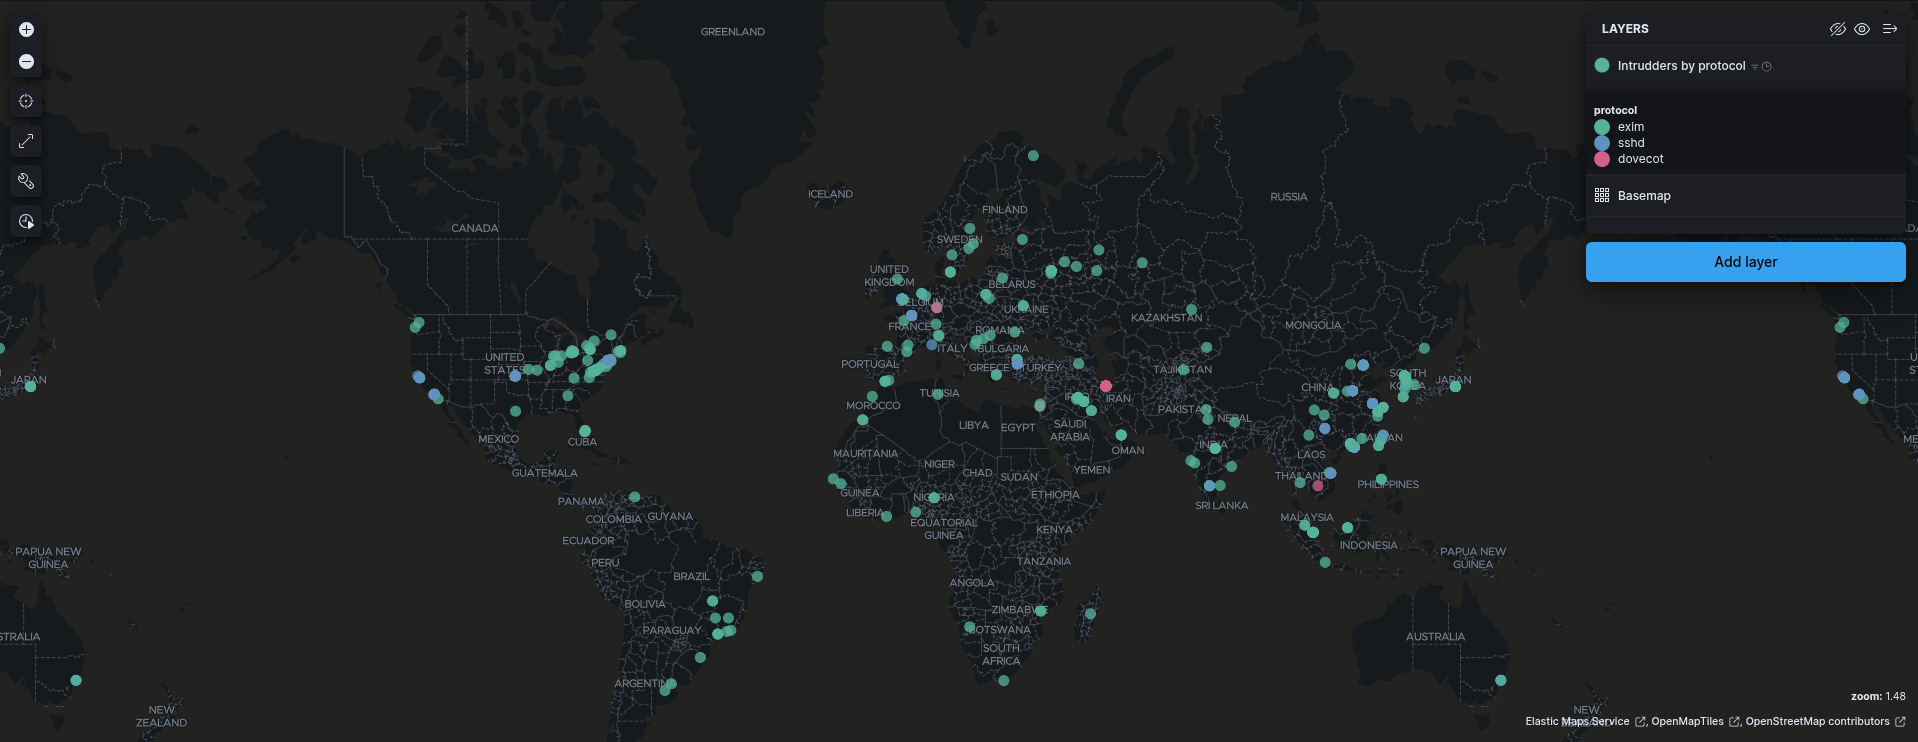
3. Geolocation of Attackers
- Use Coordinate Map Visualization.
- Display attack origins on a world map (GeoIP location field
client.geo.location)
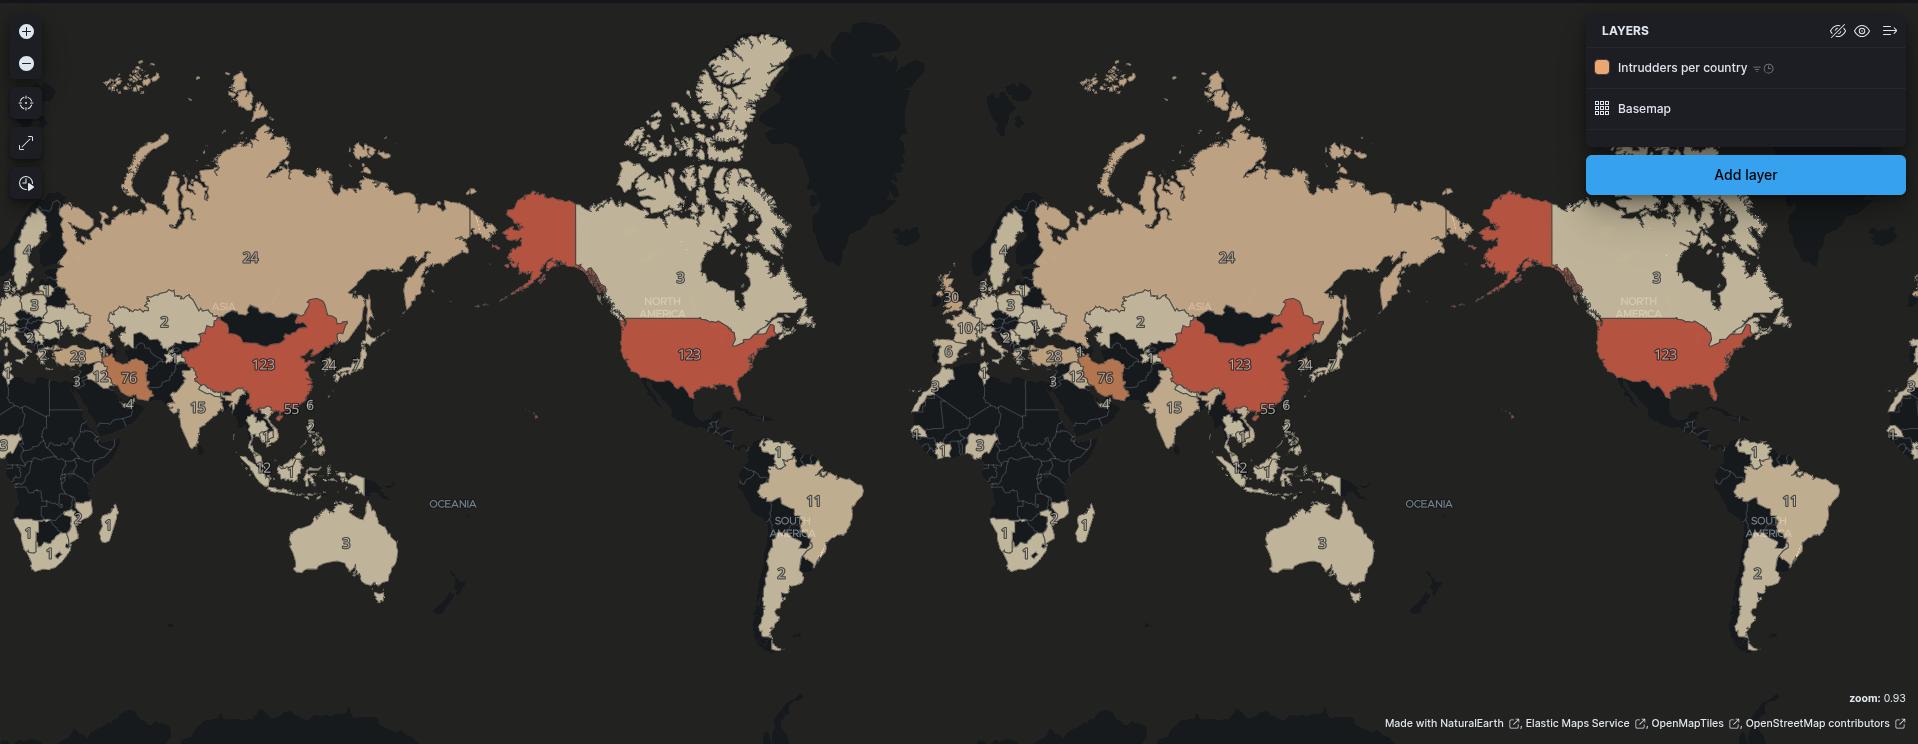
4. Attackers by country
- Use Map Visualization.
- Add new Layer of type
Choropleth - Choose
Administrative boundaries from the Elastic Maps ServiceinBoundaries source - Choose
World CountriesinEMS boundaries - In
Statistics sourceyou must select optionfail2ban-*inData viewandclient.geo.country_iso_codeinJoin field
Feel free to explore the panels and visualization on your own, and for further information, please consult the official documentation here.
Step 11: Setting Up Alerts in Kibana
Kibana can send alerts when an attack threshold is exceeded.
- Navigate to Stack Management > Rules and Connectors.
- Click Create Rule and choose Elasticsearch Query.
- Define a condition (e.g., more than 10 bans in 5 minutes).
- Configure an email or webhook notification.
- Save and activate the rule.
Conclusion
By integrating Fail2Ban, Filebeat, Elasticsearch, and Kibana using Docker Compose, you can create a real-time security monitoring dashboard. This setup provides instant insights into attack patterns and enhances security response times.
Would you like to explore further enhancements, such as integrating Machine Learning for anomaly detection? Feel free to reach out!


